
Illustrate the network security architecture of a modern hospital information system. The architecture is divided into three security zones: the Internet zone, the internal network zone, and the external connection zone. Internet traffic enters through an edge router and passes a firewall before reaching the core switch. A DMZ hosts public-facing services including the appointment and patient portal website protected by a web application firewall (WAF) and database auditing. The internal network contains multiple medical information systems, including HIS, EMR, PACS, LIS, and database auditing servers. These critical services are isolated behind internal firewalls and connected through the hospital core switching network. The office network is separated from the server network and protected by firewalls, intrusion detection systems, antivirus protection, endpoint security, and network access control. A centralized security management zone collects logs, performs vulnerability scanning, security monitoring, bastion host management, and database auditing. External connections such as medical insurance networks and dedicated partner networks communicate through secure gateways and network isolation devices. Show how traffic flows from the Internet through security boundaries into hospital services while illustrating layered defense, network segmentation, and access control.
AI MECHANISM FIGURES
AI mechanism diagram generator
Describe a broad topic. Recent research and technical analysis will isolate one important principle, then visualize that mechanism in depth.
Include the problem, technology, and the part you most want explained. The planner will avoid broad slide-like overviews.
Try an example
Includes recent research search and focused technical analysis.
Generated mechanism diagram
The image below is the generated technical mechanism diagram.
Your generated figure will appear here
Describe any domain in your own words. No fixed medical or computer-science template is imposed.
Example gallery
Mechanism diagram examples
Browse focused views from one technical mechanism. Select any card to inspect the full figure.
Illustrate the computation mechanism of a multilayer perceptron (MLP) neural network. The network receives an input feature vector and propagates it through multiple fully connected hidden layers. Each hidden layer computes a weighted linear transformation by multiplying the input features with a learnable weight matrix and adding a bias vector. The resulting linear outputs are passed through a nonlinear activation function to generate hidden feature representations. The output of one hidden layer serves as the input to the next layer. The final hidden representation is transformed through another fully connected layer to generate the output prediction. Demonstrate the mathematical relationship between input vectors, weight matrices, bias vectors, linear transformations, activation functions, hidden representations, and output predictions. Illustrate how each neuron receives inputs from all neurons in the previous layer, performs weighted summation, adds a bias term, applies a nonlinear activation function, and forwards the resulting activation to the next layer.
Illustrate the mechanism of a gated multi-scale feature fusion module for deep neural networks. Multiple feature maps extracted from different stages of a backbone network are collected and concatenated into a unified feature representation. A learnable gating feature is generated to estimate the importance of each feature channel. The concatenated features are adaptively reweighted through element-wise multiplication with the gating feature, allowing informative responses to be enhanced while suppressing irrelevant information. Meanwhile, a residual feature branch bypasses the gating operation and preserves the original semantic information. The weighted features and the residual features are combined through element-wise addition to produce the final fused feature representation. The fused output is forwarded to the prediction head for downstream tasks such as classification, detection, or segmentation. Emphasize how multi-scale information, adaptive gating, and residual learning cooperate to improve feature representation.
Illustrate the molecular mechanism by which pathological stimulation elevates blood pressure and how Captopril or constitutively active AMPKα reverses this process. Under pathological conditions, stimuli such as angiotensin II, oxidative stress, and inflammation promote the accumulation of HDAC1 in the nucleus. Nuclear HDAC1 associates with the transcription factors Sp1 and Sp3, suppressing transcription of AMPKα1 and AMPKα2. Reduced AMPK expression decreases AMPK signaling, leading to lower Caveolin-1 expression and reduced phosphorylation of eNOS at Ser1177. Impaired eNOS activation decreases nitric oxide production, causing endothelial dysfunction, vasoconstriction, inflammation, oxidative stress, and elevated blood pressure. In contrast, treatment with Captopril or constitutively active AMPKα inhibits HDAC1 activity and promotes proteasomal degradation of the HDAC1–Sp1/Sp3 complex. The restoration of Sp1/Sp3 transcriptional activity increases AMPKα1 and AMPKα2 expression and reactivates AMPK signaling. Activated AMPK increases Caveolin-1 expression and enhances eNOS phosphorylation at Ser1177, resulting in elevated nitric oxide production. Increased nitric oxide improves endothelial function, promotes vasodilation, reduces inflammation and oxidative stress, and ultimately lowers blood pressure. Emphasize the complete causal pathway from pathological stimulation through transcriptional regulation, intracellular signaling, endothelial function, vascular remodeling, and physiological outcome.
Illustrate the structure and signal transmission mechanism of a neuron. Show the major anatomical components of a neuron, including dendrites, the cell body (soma), nucleus, axon hillock, axon, myelin sheath, nodes of Ranvier, and axon terminals. Explain how dendrites receive incoming electrical signals, how these signals are integrated within the soma, and how an action potential is generated at the axon hillock. Illustrate the propagation of the action potential along the axon through saltatory conduction between the nodes of Ranvier. At the axon terminal, show how electrical signals trigger the release of neurotransmitters from synaptic vesicles into the synaptic cleft. Demonstrate how neurotransmitters bind to receptors on the postsynaptic membrane, allowing the signal to be transmitted to the next neuron. Include the internal organization of the neuron, highlighting major organelles such as the nucleus, rough endoplasmic reticulum, Golgi apparatus, mitochondria, microtubules, and ribosomes. Illustrate the microscopic organization of the synapse, including synaptic vesicles, presynaptic membrane, synaptic cleft, neurotransmitters, receptors, and postsynaptic membrane. Emphasize the relationship between neuronal structure and neural communication from signal reception to synaptic transmission.
Illustrate the therapeutic mechanism of ultrasound-activated catalytic nanoparticles for tumor treatment. As a tumor grows, increasing size leads to poor oxygen diffusion and the development of a hypoxic tumor microenvironment with heterogeneous oxygen distribution. The abnormal tumor vasculature allows nanoparticles of appropriate size to preferentially accumulate within the tumor through enhanced vascular permeability. After reaching tumor cells, catalytic nanoparticles are internalized and activated by external ultrasound stimulation. Ultrasound activation accelerates catalytic reactions that convert endogenous hydrogen peroxide into reactive oxygen species while simultaneously increasing local oxygen availability. The elevated reactive oxygen species induce oxidative stress, damage intracellular organelles, disrupt mitochondrial function, and trigger apoptosis of tumor cells. Illustrate the complete therapeutic pathway from tumor growth and hypoxia, through nanoparticle accumulation and ultrasound activation, to intracellular catalytic reactions and tumor cell death. Highlight the relationship between tumor microenvironment, nanoparticle delivery, catalytic therapy, reactive oxygen species generation, oxygen regulation, and apoptosis.
Illustrate the overlapping pathological mechanisms underlying neurodegenerative diseases. Show how multiple molecular and cellular abnormalities converge to drive progressive neuronal dysfunction and neurodegeneration. Include protein misfolding and aggregation, impaired proteostasis involving proteasomal, autophagic, and lysosomal dysfunction, oxidative stress, mitochondrial dysfunction, endoplasmic reticulum stress, inflammasome activation, DNA damage response, calcium homeostasis imbalance, and synaptic dysfunction. Illustrate the interactions between neurons, microglia, and astrocytes. Show how neuronal injury activates microglia, leading to inflammatory cytokine release and chronic neuroinflammation. Demonstrate how astrocytes undergo functional changes characterized by impaired glutamate clearance, reduced homeostatic support, increased oxidative stress, and enhanced secretion of pro-inflammatory mediators. Include the contribution of peripheral immune dysregulation and shared genetic susceptibility factors that influence multiple pathogenic pathways. Emphasize the extensive crosstalk and positive feedback among oxidative stress, mitochondrial dysfunction, protein aggregation, neuroinflammation, calcium dysregulation, and synaptic failure, ultimately resulting in progressive neuronal degeneration.
Illustrate the working mechanism of a steer-by-wire (SBW) steering system and compare it with a conventional electric power steering (EPS) system. In a conventional EPS system, the steering wheel is mechanically connected to the steering rack through the steering shaft and steering column, allowing the driver's steering input to be transmitted directly to the road wheels while an electric motor provides steering assistance. In a steer-by-wire system, the mechanical connection between the steering wheel and the steering actuator is removed. The driver's steering input is measured by steering angle and torque sensors and transmitted electronically to the steering control unit. The steering controller processes the input signals and calculates the desired steering angle using vehicle dynamics and control algorithms. The controller commands an electric steering actuator to steer the road wheels while receiving continuous feedback from steering angle, motor position, and vehicle state sensors. A steering feel simulator generates artificial steering resistance and road feedback so that the driver experiences realistic steering feel despite the absence of a mechanical linkage. Illustrate the complete control loop from driver input through electronic signal transmission, steering control, actuator execution, sensor feedback, and steering feel generation. Highlight the transition from mechanically coupled steering to electronically controlled steer-by-wire architecture.
Use cases
Explain complex mechanisms visually
From a research hypothesis to a technical system, turn the essential logic into a figure that is easier to read, review, and discuss.
Scientific research mechanisms
Turn biological pathways, molecular interactions, clinical mechanisms, and materials processes into publication-ready visual explanations.
AI and technical systems
Clarify model architectures, data pipelines, security controls, retrieval flows, and algorithmic principles without a generic slide layout.
Engineering principles
Map energy transfer, control loops, thermal processes, circuits, mechanical structures, and manufacturing mechanisms with clear causality.
Workflow
From description to diagram in three focused steps
Describe the mechanism
Explain the system, process, or research question in your own words. Include the relationships you want readers to understand.
AI identifies the core principle
The planner narrows broad context into the components, causal chain, interfaces, and state changes that deserve the diagram.
Generate and refine
Get a focused technical visual with restrained labels, deliberate arrows, and a composition designed for serious communication.
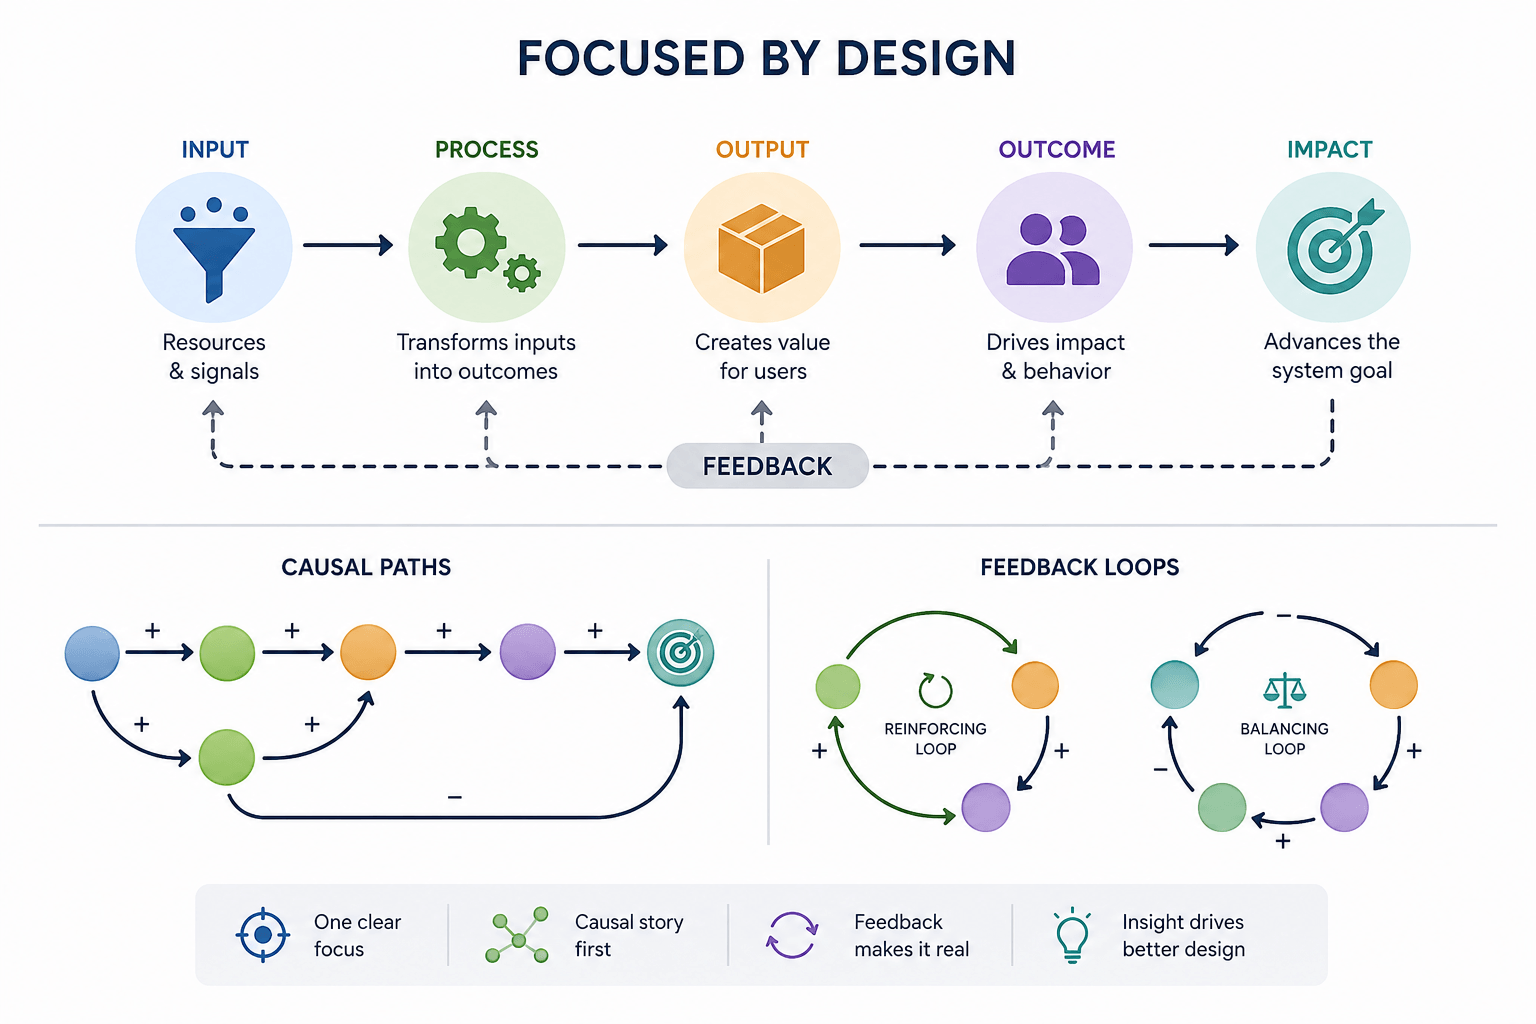
FOCUSED BY DESIGN
Show the principle, not just the topic
A strong mechanism figure makes one important relationship immediately legible. The generator plans around the causal story before drawing, so the result reads as a coherent explanation rather than a collection of concepts.
- Core components and their roles
- Causal paths and feedback loops
- Only the labels readers need
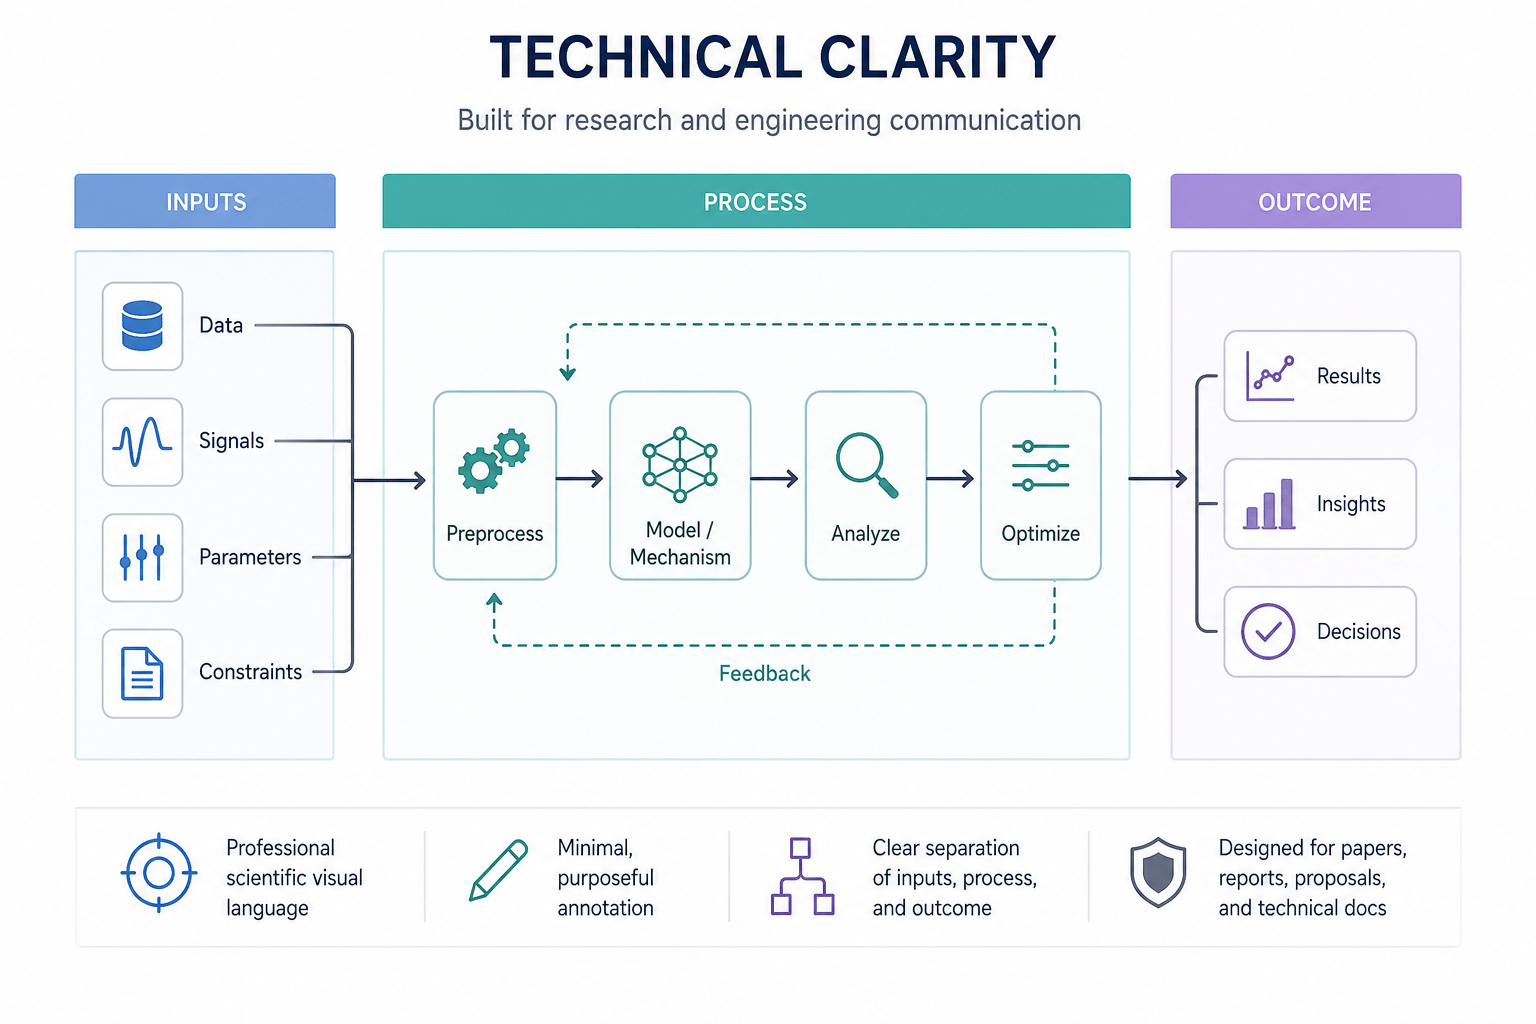
TECHNICAL CLARITY
Built for research and engineering communication
Mechanism diagrams need discipline: functional geometry, visual hierarchy, precise arrows, and a restrained palette. The output is designed to support papers, reports, proposals, and technical documentation.
- Professional scientific visual language
- Minimal, purposeful annotation
- Clear separation of inputs, process, and outcome
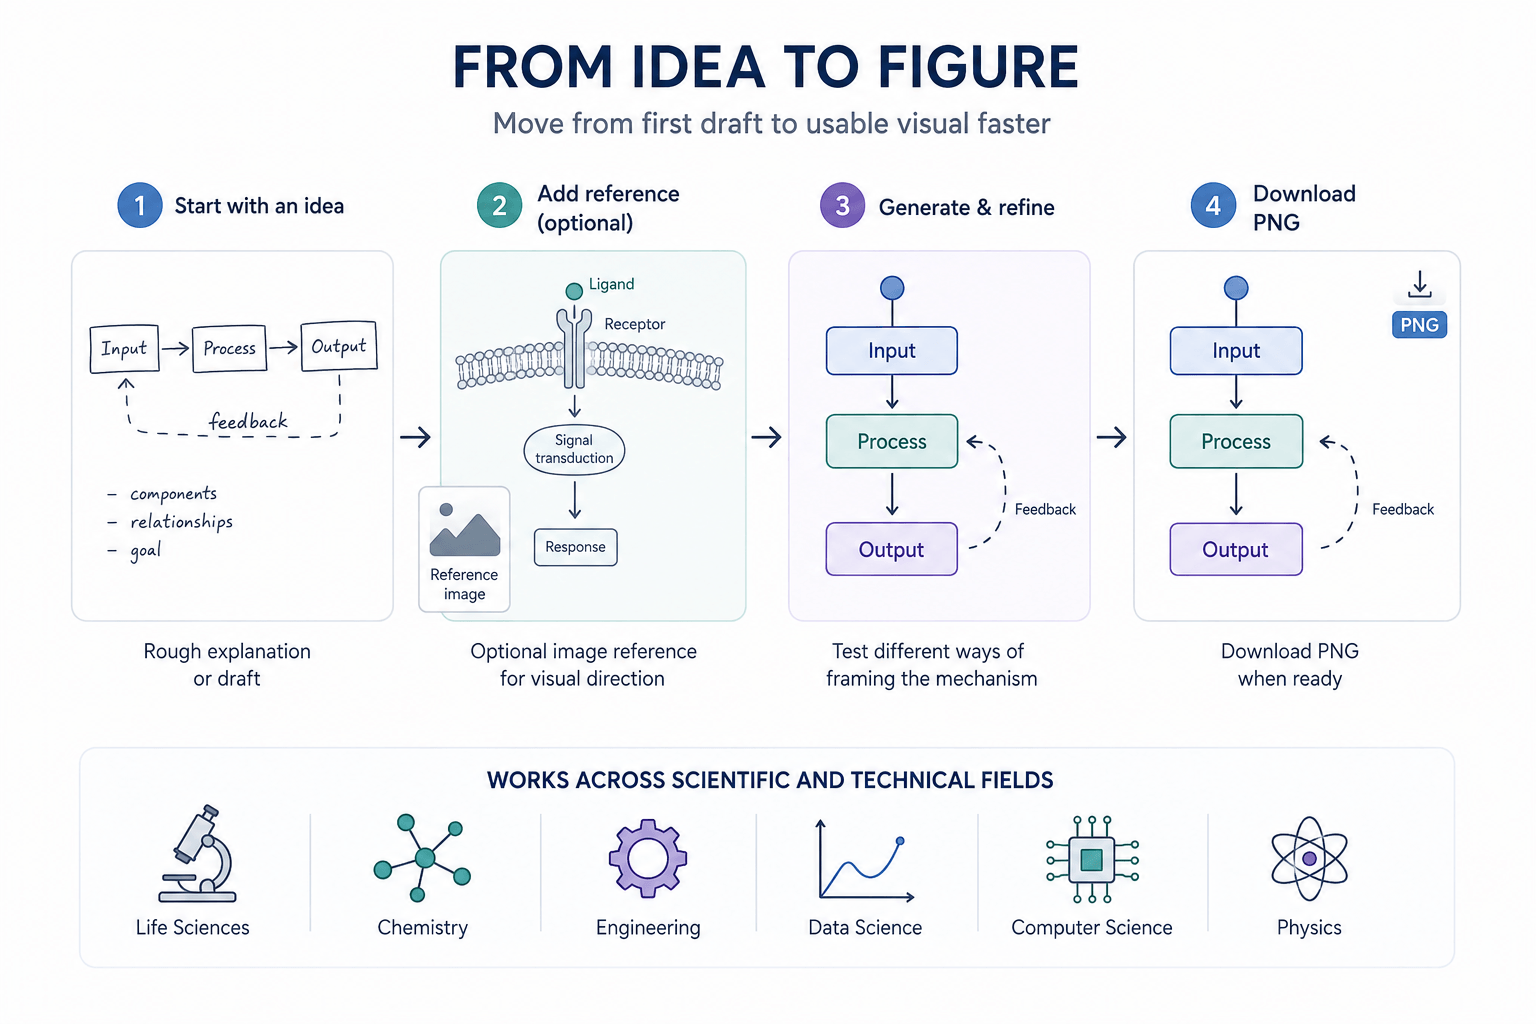
FROM IDEA TO FIGURE
Move from first draft to usable visual faster
Start with a rough explanation or an existing reference image. You can test different ways of framing the mechanism without rebuilding every relationship manually in diagram software.
- Optional image reference for visual direction
- Download a PNG when the figure is ready
- Works across scientific and technical fields
Made for people who explain how things work
Researchers and students
Explain a hypothesis, pathway, model, or method in a paper, thesis, poster, or lab presentation.
Product and technical teams
Align colleagues around system behavior, data movement, security design, and complex product workflows.
Engineers and analysts
Document a process, operational model, fault chain, or physical mechanism with an easier-to-scan visual.
Medical and scientific communicators
Make a technical explanation easier to discuss across research, clinical, academic, and stakeholder audiences.
FAQ
Frequently asked questions
Everything you need to know before you create your first mechanism diagram.
What can I create with the AI mechanism diagram generator?
You can create focused diagrams for scientific mechanisms, biological pathways, technical architectures, engineering processes, security controls, and algorithmic workflows.
How specific should my description be?
Start with the subject and the relationship you want to explain. Useful details include important components, the direction of the process, known inputs or outputs, and your preferred language for labels.
Can I use a reference image?
Yes. Attach a PNG, JPG, or WebP image to guide the composition or visual direction. The image is used as a reference alongside your written description.
Is the generated diagram suitable for a research paper?
It is designed as a strong technical starting point for research and professional documentation. Review scientific facts, terminology, and publication requirements before final submission.
Ready to visualize your mechanism?
Describe the principle you need to explain and create a focused technical diagram in a few steps.
Create a mechanism diagram